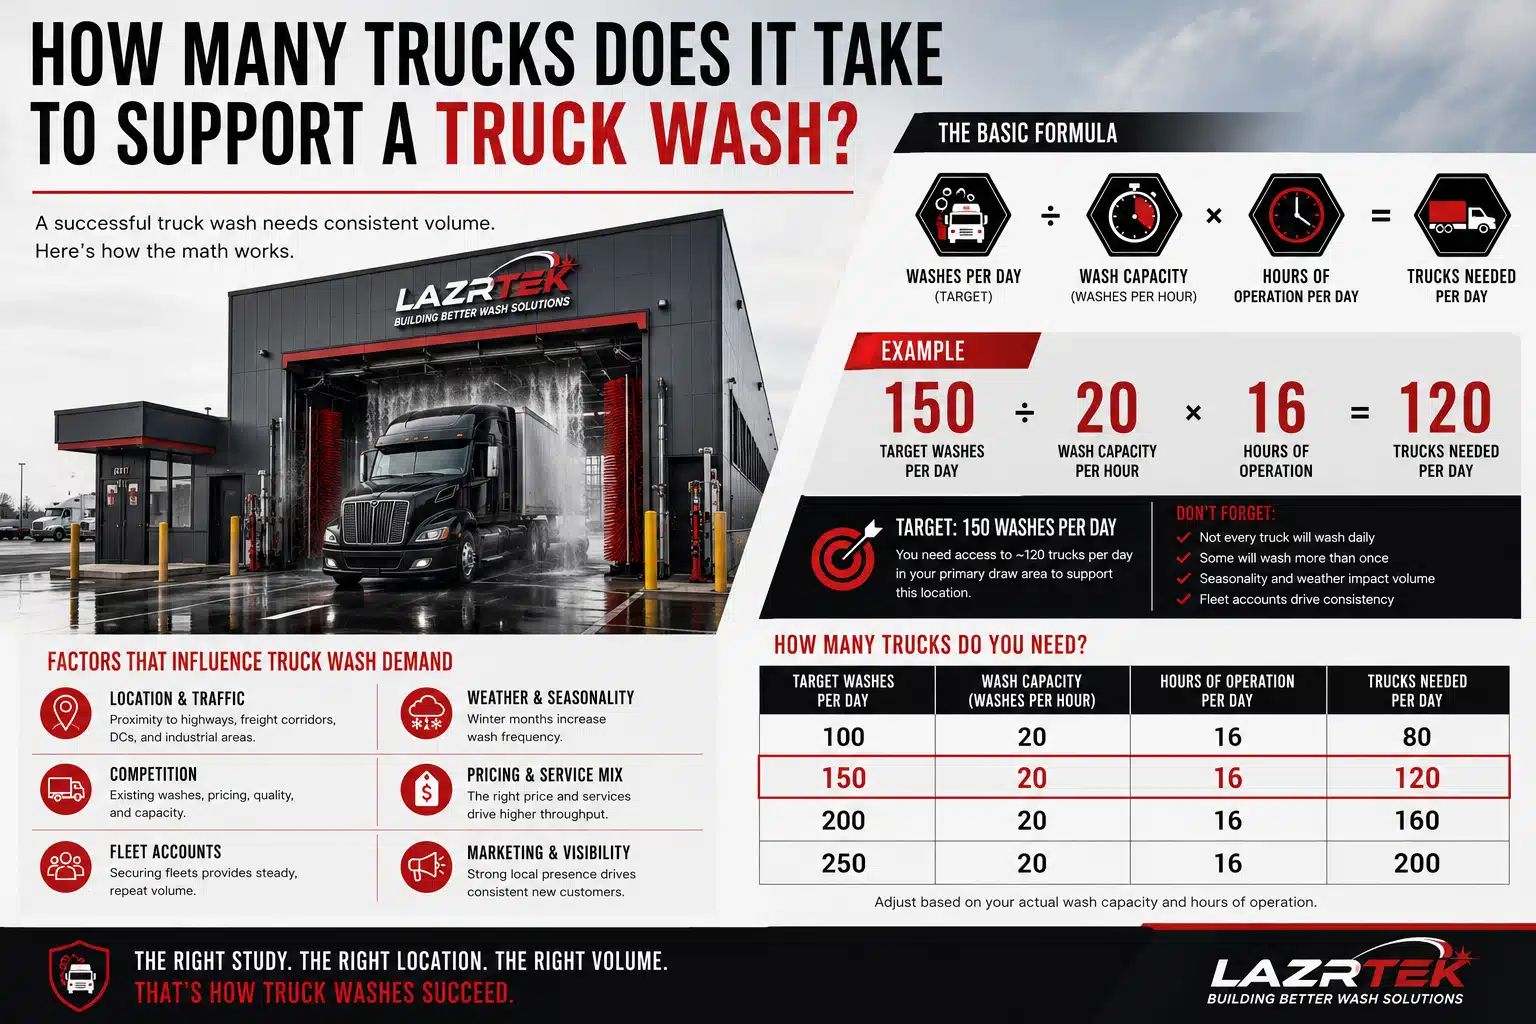
Every wash project ultimately rests on one equation: enough trucks, close enough, dirty often enough, with few enough alternatives. Everything else — equipment, chemistry, marketing — determines how much of that demand you capture. The demand itself comes from the map.
The four inputs
Corridor volume. How many trucks pass the site daily? State DOTs and the Bureau of Transportation Statistics publish traffic data, but corridor-level truck counts — not total vehicle counts — are what matter, and they vary enormously by segment.
Anchored demand. Depots, distribution centers, and food processors within the draw radius wash on schedules, not impulse. A single DC with a large private fleet can anchor more predictable volume than thousands of pass-by trucks — which is why site selection analysis maps anchors, not just traffic.
Wash frequency. Retail-image fleets wash weekly; food-grade carriers wash out per load; owner-operators stretch intervals. Your realistic frequency mix comes from the fleet types in your radius.
Capture rate. The honest variable. Location geometry (can a tired driver get in and out easily?), pricing, speed, and marketing decide what share of available demand actually turns into your radius.
Why averages lie
“The average truck wash serves X trucks a day” is a useless sentence — the distribution is wildly wide, and your project will live at a specific point on it determined by your specific corridor. That point is exactly what a feasibility study calculates: your counts, your anchors, your competition, your capture assumptions stress-tested against a downside case. If the equation clears with room to spare, you have a project. If it clears only in the optimistic case, you have a warning.