You don’t need a business intelligence suite to run a wash well. You need five numbers, written down weekly, compared against last month. Every expensive problem announces itself in these five before it shows up in the bank account.
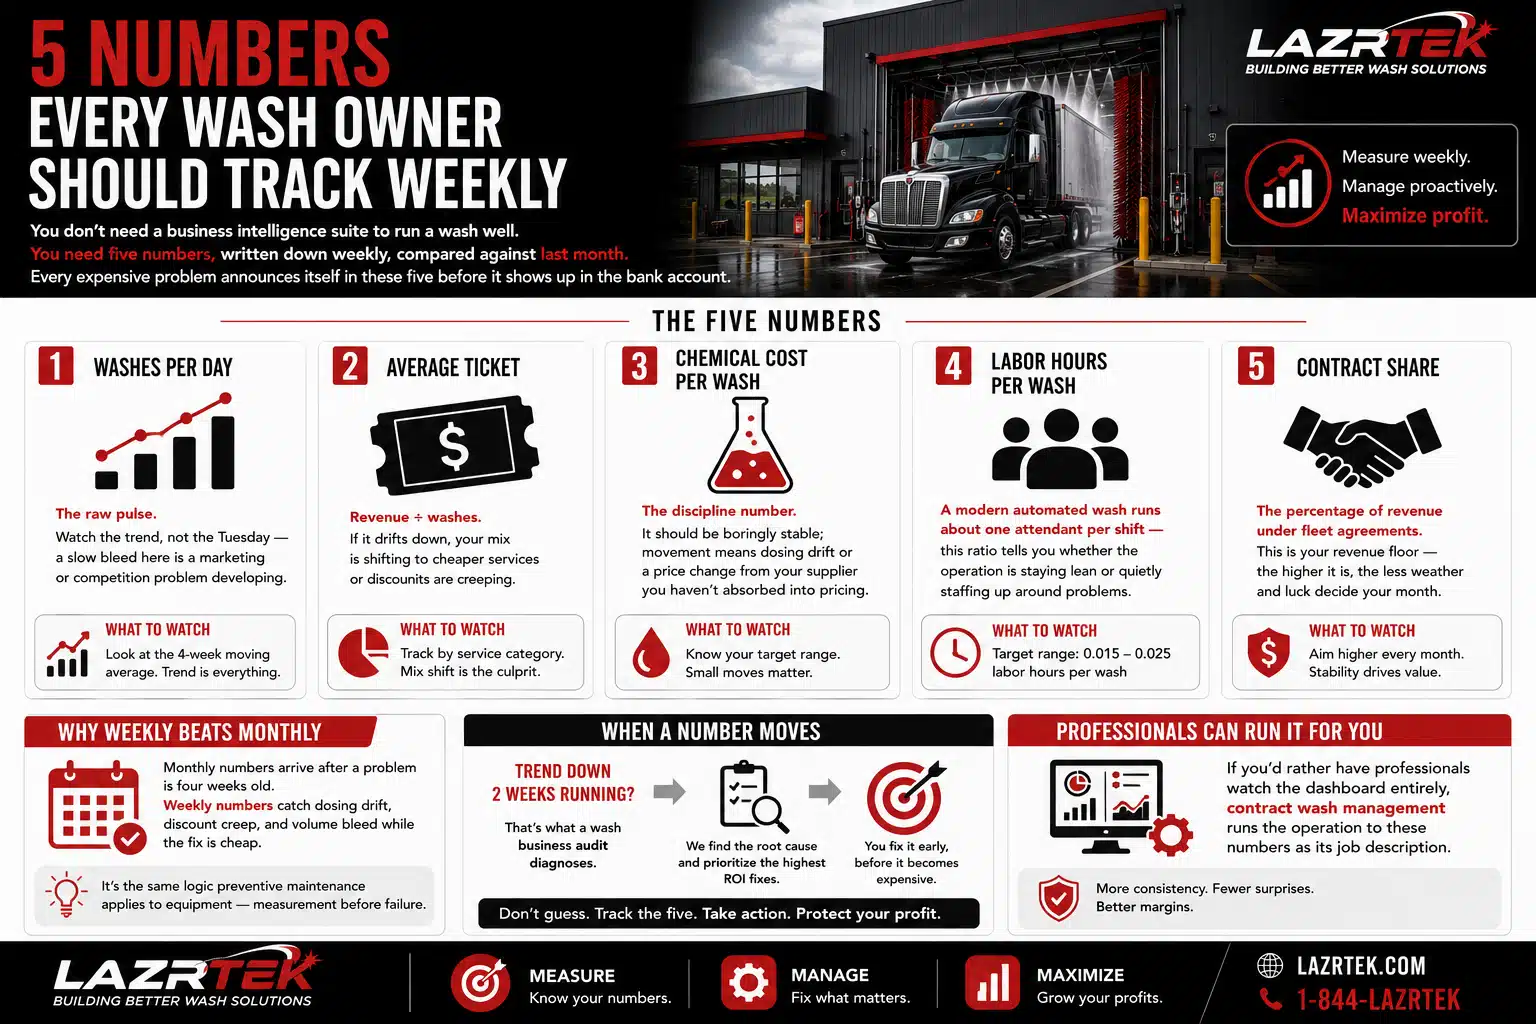
The five
1. Washes per day. The raw pulse. Watch the trend, not the Tuesday — a slow bleed here is a marketing or competition problem developing.
2. Average ticket. Revenue ÷ washes. If it drifts down, your mix is shifting to cheaper services or discounts are creeping.
3. Chemical cost per wash. The discipline number. It should be boringly stable; movement means dosing drift or a price change from your supplier you haven’t absorbed into pricing.
4. Labor hours per wash. A modern automated wash runs about one attendant per shift — this ratio tells you whether the operation is staying lean or quietly staffing up around problems.
5. Contract share. The percentage of revenue under fleet agreements. This is your revenue floor — the higher it is, the less weather and luck decide your month.
Why weekly beats monthly
Monthly numbers arrive after a problem is four weeks old. Weekly numbers catch dosing drift, discount creep, and volume bleed while the fix is cheap. It’s the same logic preventive maintenance applies to equipment — measurement before failure.
When a number moves
Trend down two weeks running? That’s what a wash business audit diagnoses — and if you’d rather have professionals watch the dashboard entirely, contract wash management runs the operation to these numbers as its job description.