TL;DR: America’s Truck Wash Crisis
The Crisis: The U.S. has massive “truck wash deserts” with less than 30% of truck stops offering wash facilities and gaps of 200-400+ miles between services on major freight corridors.
The Scale:
- 37.9 million commercial vehicles need regular washing
- ~2,000 dedicated truck wash locations nationwide (severely inadequate)
- Major gaps on I-80 Nevada (200+ miles), I-90 Montana (250+ miles), and other critical routes
The Cost: Fleet operators face:
- Higher maintenance costs from inadequate cleaning access
- Fuel efficiency losses from dirty, non-aerodynamic surfaces
- Equipment degradation from road salt and chemical buildup
- DOT compliance risks from poor vehicle appearance
Optimal Maintenance Strategy:
- Weekly washing: Best ROI for most fleets
- Ceramic coatings: 3-9 year protection vs. 2-3 months for wax
- Mobile services: Fill gaps in underserved areas
- Route planning: Essential around available facilities
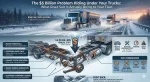
The Opportunity: $500+ million investment needed to properly serve underserved corridors, with mobile wash services growing 15% annually to fill critical gaps.
Bottom Line: America’s truck wash infrastructure is failing its $800+ billion freight industry. Fleet operators must strategically plan around existing facilities while investing in long-term protection like ceramic coatings. The industry needs massive infrastru
A comprehensive analysis of truck wash availability across the United States, identifying wash deserts, optimal cleaning frequencies, and the critical role of protective coatings in fleet maintenance
Executive Summary
America’s commercial trucking industry faces a critical infrastructure challenge: insufficient truck wash coverage across the nation’s 47,000+ miles of interstate highways. With less than 30% of truck stops offering wash bays and significant “wash deserts” spanning hundreds of miles, fleet operators must strategically plan maintenance while understanding optimal washing frequencies and advanced protection methods.
Key Findings:
- Less than 30% of truck stops have dedicated wash bays
- Wash deserts of 200+ miles exist in rural corridors
- Weekly washing provides optimal protection and ROI
- Ceramic coatings extend protection periods to 3-9 years
- Mobile wash services fill critical infrastructure gaps
The Current State of Truck Wash Infrastructure
National Truck Wash Distribution
The United States car wash industry generates $14.7 billion annually, but commercial truck washing represents a significantly smaller segment despite the critical need for the nation’s 37.9 million commercial vehicles.
Industry Infrastructure Breakdown:
- Total car wash facilities: ~65,000 nationwide
- Truck wash capabilities: <30% of facilities
- Dedicated truck wash centers: ~1,500-2,000 locations
- Mobile truck wash services: Growing sector filling gaps
Geographic Distribution Challenges
Major Truck Stop Chains with Wash Facilities:
- Blue Beacon: Leading dedicated truck wash network with 400+ locations
- TravelCenters of America (TA): Selective wash bay availability
- Love’s Travel Stops: Limited wash facilities at major locations
- Flying J: Sporadic wash bay integration
- Pilot: Variable wash service availability
Regional Coverage Disparities
Well-Served Corridors:
- I-95 Eastern Seaboard: Adequate coverage from Maine to Florida
- I-10 Southern Corridor: Reasonable distribution Texas to California
- I-80 Northern Route: Moderate coverage across northern states
- I-75 North-South: Good coverage through southeastern states
Underserved Areas:
- Rural Interstate segments: 100-300 mile gaps common
- Mountain corridors: Limited facilities due to terrain challenges
- Northern border routes: Sparse coverage in remote areas
- Secondary commercial routes: Minimal dedicated truck wash access
America’s Truck Wash Deserts: Critical Infrastructure Gaps
Defining Wash Deserts
A “truck wash desert” is defined as any interstate corridor with more than 100 miles between facilities offering commercial vehicle washing services, considering the operational reality that trucks should be washed weekly for optimal maintenance.
Identified Wash Desert Regions
Western Corridors:
- I-80 Nevada: 200+ mile gap between Reno and Salt Lake City
- I-10 West Texas: 150+ mile stretches through desert regions
- I-15 Nevada-Utah: Extended gaps in remote desert areas
- I-90 Montana: 250+ mile segments with no truck wash facilities
Mountain Regions:
- I-70 Colorado: High-altitude segments with limited services
- I-84 Idaho: Rural mountain corridor gaps
- I-40 Arizona: Desert segments with sparse coverage
- I-25 Wyoming-Colorado: Northern segments underserved
Northern Border Routes:
- I-94 North Dakota: Extended rural segments
- I-90 South Dakota: Prairie corridor gaps
- I-2 Texas: Border region limited coverage
- US-2 Northern Route: Minimal truck wash infrastructure
Rural Secondary Routes:
- US-69 Texas: Limited facilities between major cities
- US-287 Texas-Colorado: Sparse rural coverage
- US-83 Great Plains: North-south corridor gaps
- US-50 “Loneliest Road”: Nevada desert corridor
Distance Analysis: Interstate Truck Wash Spacing
Current Average Spacing:
- Dense urban corridors: 25-50 miles between facilities
- Suburban interstate segments: 50-100 miles typical spacing
- Rural corridors: 100-200+ miles common gaps
- Remote desert/mountain areas: 200-400+ mile gaps
Recommended Optimal Spacing:
- High-traffic corridors: Every 50-75 miles
- Moderate traffic routes: Every 100-125 miles
- Rural corridors: Every 150-175 miles maximum
- Emergency coverage: Mobile services for extended gaps
The Economics of Truck Wash Availability
Market Size and Growth Projections
Commercial Vehicle Washing Market:
- Current market size: $2.1 billion annually
- Growth rate: 4-6% annually
- Fleet washing segment: 45% of total market
- Mobile services: 15% annual growth rate
Investment Gaps and Opportunities
Infrastructure Investment Needs:
- Underserved corridor development: $500 million investment opportunity
- Mobile service expansion: $150 million market potential
- Technology integration: $75 million modernization need
- Environmental compliance: $100 million upgrade requirement
Regional Economic Impact
High-Demand Underserved Markets:
- Oil field corridors: High truck volume, limited wash access
- Agricultural routes: Seasonal demand spikes, inadequate capacity
- Port access roads: Concentrated traffic, insufficient facilities
- Manufacturing corridors: Regular fleet traffic, service gaps
Optimal Truck Washing Frequency: The Science of Fleet Maintenance
Industry Best Practices Analysis
Based on comprehensive analysis of fleet operations, environmental conditions, and cost-benefit ratios, optimal washing frequencies vary by operational type and environmental exposure.
Recommended Washing Frequencies:
| Vehicle Type | Optimal Frequency | Environmental Factors | ROI Justification |
|---|---|---|---|
| Long-haul OTR | Weekly | High road chemical exposure | Corrosion prevention, fuel efficiency |
| Regional delivery | Bi-weekly | Moderate environmental stress | Professional appearance, maintenance |
| Local/urban fleet | Weekly | Urban pollution, stop-and-go | Professional image, resale value |
| Specialized hauling | As required + weekly | Cargo-specific contamination | Regulatory compliance, equipment protection |
| Food-grade transport | After each load + weekly | Sanitation requirements | FDA compliance, trailer longevity |
Environmental Impact on Washing Frequency
High-Frequency Washing Zones (2-3x per week):
- Coastal areas: Salt air corrosion acceleration
- Winter salt regions: Road de-icer exposure
- Industrial corridors: Chemical contamination risk
- Construction zones: Excessive dust and debris
Standard Frequency Zones (Weekly):
- Typical highway corridors: Normal road grime
- Temperate climate regions: Moderate environmental stress
- Mixed urban/rural routes: Variable contamination
- Standard freight operations: Regular maintenance needs
Reduced Frequency Acceptable (Bi-weekly):
- Dry climate regions: Lower corrosion risk
- Limited exposure routes: Minimal contamination
- Specialized operations: Controlled environments
- Economic optimization: Cost-sensitive operations
The Economics of Washing Frequency
Cost-Benefit Analysis by Frequency
Weekly Washing Program:
- Annual cost per vehicle: $1,560-$2,600
- Maintenance savings: $1,500-$4,000 annually
- Fuel efficiency gain: $800-$2,500 annually
- Net annual benefit: $740-$3,940 per vehicle
Bi-weekly Washing Program:
- Annual cost per vehicle: $780-$1,300
- Maintenance savings: $800-$2,000 annually
- Fuel efficiency gain: $400-$1,200 annually
- Net annual benefit: $420-$1,900 per vehicle
Monthly Washing Program:
- Annual cost per vehicle: $390-$650
- Maintenance savings: $300-$800 annually
- Fuel efficiency gain: $200-$600 annually
- Net annual benefit: $110-$750 per vehicle
ROI Optimization by Fleet Type
High-Mileage Long-Haul Operations: Weekly washing provides 2.5-3.0x ROI through:
- Enhanced fuel efficiency from aerodynamic optimization
- Reduced corrosion maintenance costs
- Extended vehicle lifespan
- Improved DOT inspection outcomes
Regional Delivery Fleets: Bi-weekly washing achieves 2.0-2.5x ROI through:
- Professional appearance maintenance
- Moderate fuel efficiency gains
- Regulatory compliance assurance
- Customer confidence enhancement
Urban/Local Operations: Weekly washing delivers 1.8-2.2x ROI through:
- Brand image protection
- Reduced environmental damage
- Enhanced driver satisfaction
- Improved resale values
Advanced Protection: Wax and Ceramic Coatings for Commercial Vehicles
Traditional Wax Protection Benefits
Standard Automotive Wax Applications:
- Protection duration: 2-3 months typical
- Application frequency: 4-6 times annually
- Cost per application: $50-150 per vehicle
- Primary benefits: UV protection, water beading, gloss enhancement
Commercial-Grade Wax Systems:
- Heavy-duty formulations: Extended durability for harsh conditions
- Application methods: Manual, spray-on, or automated systems
- Enhanced protection: Superior road salt and chemical resistance
- Professional application: Consistent coverage and optimal results
Ceramic Coating Revolution for Fleet Operations
Ceramic Coating Technology Overview: Ceramic coatings represent a revolutionary advancement in vehicle protection, offering 3-9 years of protection from a single application, fundamentally changing fleet maintenance economics.
Key Ceramic Coating Benefits:
| Feature | Traditional Wax | Ceramic Coating | Advantage Factor |
|---|---|---|---|
| Durability | 2-3 months | 3-9 years | 12-36x longer |
| Scratch resistance | Limited | Superior | 5-10x improvement |
| Chemical protection | Moderate | Excellent | 3-5x better |
| UV resistance | Good | Outstanding | 2-3x superior |
| Maintenance frequency | Monthly | Quarterly | 75% reduction |
Commercial Vehicle Ceramic Coating Applications
Fleet-Specific Advantages:
- Extended protection periods: Reduces maintenance frequency by 75%
- Enhanced chemical resistance: Superior protection against road salts and de-icers
- Improved fuel efficiency: Maintains optimal aerodynamic surface properties
- Professional appearance: Consistent gloss and color depth retention
- Reduced cleaning requirements: Hydrophobic properties facilitate easier washing
Application Considerations:
- Professional installation required: Certified technicians ensure optimal results
- Surface preparation critical: Proper paint correction and cleaning essential
- Initial investment: $500-2,000 per vehicle depending on size and coating quality
- Long-term value: 3-5 year protection reduces annual maintenance costs significantly
Ceramic Coating ROI for Commercial Fleets
Investment Analysis:
- Initial coating cost: $800-1,500 per truck (professional application)
- Annual maintenance reduction: $400-800 per vehicle
- Extended protection period: 3-5 years typical
- Total ROI: 150-300% over coating lifespan
Operational Benefits:
- Reduced wash frequency: From weekly to bi-weekly or monthly
- Lower chemical costs: Reduced need for aggressive cleaning agents
- Enhanced resale value: Superior paint condition at trade-in
- Professional image: Consistent fleet appearance with minimal maintenance
Advanced Coating Technologies
Graphene-Enhanced Ceramic Coatings: The latest innovation combines ceramic durability with graphene strength, offering:
- Superior scratch resistance: Diamond-level hardness characteristics
- Enhanced heat resistance: Better performance in extreme temperatures
- Extended durability: Up to 1-year protection with proper maintenance
- Professional application: Requires specialized training and equipment
Hybrid Coating Systems: Modern formulations combine multiple technologies:
- Ceramic-wax hybrids: Extended durability with easy application
- Nano-technology integration: Molecular-level protection enhancement
- Self-healing properties: Minor scratch resistance and recovery
- Environmental adaptability: Performance optimization for specific climates
Regional Washing Strategy Recommendations
High-Traffic Corridor Strategy
I-95, I-10, I-75, I-80 Corridors:
- Wash frequency: Weekly optimal
- Facility spacing: Every 50-75 miles adequate
- Service type: Mix of automated and full-service facilities
- Coating strategy: Annual ceramic coating application
Rural Corridor Adaptation
Remote Interstate Segments:
- Mobile wash services: Critical infrastructure supplement
- Extended protection: Ceramic coatings essential for 200+ mile gaps
- Strategic planning: Route-based wash scheduling
- Emergency services: Partnerships with mobile providers
Climate-Specific Approaches
Salt Belt Regions (Northern States):
- Increased frequency: 2-3x weekly during winter months
- Specialized treatments: Road salt neutralization protocols
- Undercarriage focus: Enhanced cleaning of critical components
- Protective coatings: Mandatory for corrosion prevention
Desert Regions (Southwest):
- Dust management: Focus on air intake and cooling system cleaning
- UV protection: Enhanced coating systems for extreme sun exposure
- Water conservation: Recycling systems for sustainability
- Heat resistance: Specialized formulations for extreme temperatures
Technology Solutions for Infrastructure Gaps
Mobile Truck Wash Services
Market Growth and Coverage:
- Service expansion: 15% annual growth in mobile wash sector
- Coverage improvement: Mobile units service 200+ mile gap areas
- Technology integration: GPS scheduling and route optimization
- Specialized equipment: Water recycling and waste management systems
Mobile Service Advantages:
- Flexible scheduling: On-site service at fleet terminals
- Specialized equipment: Comparable quality to fixed facilities
- Environmental compliance: Portable water treatment systems
- Cost efficiency: Reduced fuel costs and driver time
Digital Integration Solutions
Smart Washing Networks:
- App-based location services: Real-time facility availability
- Automated scheduling: Integration with fleet management systems
- Quality tracking: Customer feedback and service monitoring
- Payment integration: Seamless billing and expense management
Route Optimization Technology:
- Wash scheduling integration: Route planning includes wash stops
- Predictive maintenance: AI-driven wash frequency optimization
- Environmental monitoring: Automatic adjustment for conditions
- Fleet tracking: Real-time vehicle cleanliness assessment
Future Infrastructure Development
Industry Investment Priorities
Critical Development Areas:
- Western desert corridors: 500+ mile segments need major investment
- Mountain pass facilities: High-altitude wash capabilities
- Border region coverage: International freight corridor enhancement
- Secondary route development: Agriculture and energy sector support
Technology Modernization:
- Automated wash systems: Reduced labor costs and consistent quality
- Water recycling: Environmental compliance and cost reduction
- Energy efficiency: Solar power and sustainable operations
- Digital integration: Seamless fleet management connectivity
Economic Development Opportunities
Franchise Expansion Potential:
- Underserved markets: 200+ locations needed for optimal coverage
- Investment requirements: $300,000-800,000 per facility
- ROI projections: 18-24 month payback in high-traffic areas
- Partnership opportunities: Truck stop and fuel station integration
Best Practices for Fleet Operators
Strategic Wash Planning
Route-Based Optimization:
- Weekly route analysis: Identify optimal wash stop locations
- Seasonal adjustments: Modify frequency based on environmental conditions
- Cost management: Negotiate fleet discounts and service agreements
- Quality assurance: Establish service standards and monitoring protocols
Protective Coating Investment Strategy
Fleet Size Considerations:
- Small fleets (1-10 vehicles): Annual wax programs with selective ceramic coating
- Medium fleets (11-50 vehicles): Ceramic coating rotation over 2-3 years
- Large fleets (50+ vehicles): Comprehensive ceramic coating programs with maintenance contracts
ROI Maximization:
- Professional application: Ensure proper surface preparation and technique
- Maintenance protocols: Regular washing and coating booster applications
- Documentation: Track protection performance and reapplication timing
- Quality monitoring: Regular inspection and touch-up scheduling
Conclusion: Building America’s Truck Wash Future
The current state of America’s truck wash infrastructure represents both a critical challenge and significant opportunity. With less than 30% of truck stops offering wash facilities and extensive wash deserts spanning critical freight corridors, the industry must innovate to meet the maintenance needs of 37.9 million commercial vehicles.
Immediate Action Items:
- Infrastructure investment: $500+ million needed for underserved corridor development
- Mobile service expansion: Fill critical gaps with flexible solutions
- Technology integration: Digital platforms for optimization and scheduling
- Advanced protection: Ceramic coating adoption for extended maintenance intervals
Long-term Strategic Vision:
- Optimal facility spacing: Every 100-150 miles maximum on major corridors
- Technology modernization: Automated, environmentally sustainable facilities
- Service integration: Seamless connection with fleet management systems
- Advanced protection: Industry-wide adoption of ceramic coating technologies
The Economic Case: For fleet operators, the mathematics are clear: weekly washing programs deliver 2.5-3.0x ROI through fuel efficiency, maintenance savings, and equipment longevity. Ceramic coatings provide 3-9 years of protection with 150-300% ROI, fundamentally changing fleet maintenance economics.
The Infrastructure Imperative: America’s freight mobility depends on a robust truck wash infrastructure. Current gaps not only increase operational costs but also accelerate equipment deterioration and reduce fleet efficiency. Strategic investment in wash facilities, mobile services, and advanced protection technologies will support the $800+ billion trucking industry while enhancing environmental sustainability and operational efficiency.
The path forward requires coordinated investment from multiple stakeholders: truck stop operators, fleet management companies, technology providers, and government infrastructure programs. By addressing current wash deserts and implementing optimal maintenance frequencies with advanced protection systems, America can build a truck wash infrastructure worthy of the world’s largest freight transportation network.
About LazrTek: Leading provider of commercial truck washing solutions and ceramic coating technologies, serving fleet operators nationwide with cutting-edge cleaning systems and advanced protective treatments. Visit LazrTek.com for comprehensive fleet maintenance solutions.